
PROJECTS
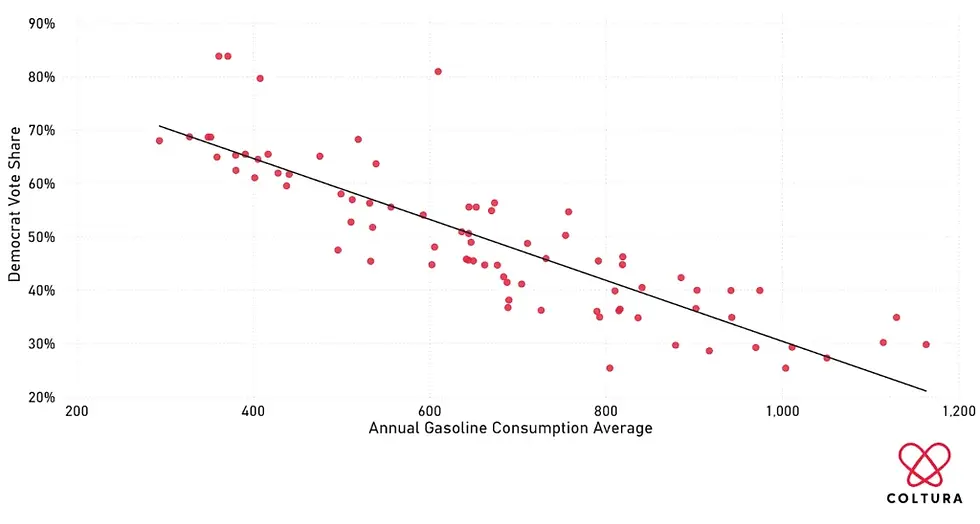
Classical statistics analysis of the relationship between gasoline expenditure and political preferences in swing states ahead of the 2024 election
In preparation for the 2024 election, I explored the relationship between gasoline expenditure and political preferences, focusing on swing states. I conducted a thorough analysis that combined statistical rigor and creativity, ultimately producing the “Driving the Vote” report. This report introduced innovative theories and trends, shedding light on how gasoline consumption patterns intersect with voter behavior and electoral outcomes. My work provided a fresh perspective on the dynamic relationship between energy policy and political trends, contributing valuable insights for policymakers and analysts.
An interactive dashboard that shows drivers their per-mile EV fuel savings based on factors like state, vehicle type, and mileage.
At Coltura, I independently designed and developed the EV Cost Savings Index, a quarterly data dashboard that helps drivers understand their per-mile fuel savings when switching to electric vehicles. This project involved integrating and analyzing multiple data sources, carefully weighing methodologies, and implementing assumptions to produce accurate, actionable insights tailored to drivers’ specific circumstances, including state, vehicle type, and annual mileage. This tool and its findings were featured in CBS News, Quartz, and Fast Company.

With insights from detailed gasoline usage data, this study highlights Hawai‘i’s high-consumption drivers and proposes targeted EV transition strategies to cut costs and emissions at scale.
I co-authored and led all data analysis and visualizations for Power Pivot: Transitioning Hawai'i Gasoline Superusers to Electric Vehicles, a 2024 report published by Coltura. Using cutting-edge gasoline consumption modeling, I identified Hawai'i’s "Gasoline Superusers"—the top 7% of drivers consuming 26% of the state’s gasoline—and analyzed their driving patterns, vehicle choices, and financial burdens. My work revealed how targeted EV incentives and infrastructure could save these drivers over $5,300 annually while cutting emissions by 680,000 metric tons statewide. I designed all visualizations, including maps of Superuser concentrations and income-to-gasoline expenditure analyses, to clearly communicate findings to policymakers and advocates. The report provides a roadmap for reducing gasoline use equitably and advancing Hawai'i’s clean energy goals.

A deep dive into the gasoline burden on rural drivers, this report outlines the unique financial and environmental gains achievable through EV adoption in rural communities.
I co-authored and led all data analysis and visualizations for Country Crossroads: Rural Drivers' Gasoline Use and Benefits of Switching to EVs, a 2024 report by Coltura. This report uses advanced gasoline consumption modeling to spotlight rural "Gasoline Superusers," who account for nearly 13% of the nation’s gasoline consumption while comprising just 3.6% of drivers. Through detailed demographic and geographic analysis, I highlighted the financial burden faced by these drivers—many spending over a quarter of their household income on gasoline—and the potential savings of nearly $4,000 annually from switching to electric vehicles. This report provides data-driven recommendations to policymakers and stakeholders on prioritizing rural Superusers for EV transition programs, reducing emissions, and enhancing economic resilience in rural communities.

Comprehensive analysis introduces data-backed approaches to cut gasoline consumption, offering relief for those most impacted by fuel costs and promoting an accelerated transition to EVs.
I co-authored and produced all data analysis and visuals for 2024's Cracking the Gasoline Code, a report by published by Coltura. This report used novel gasoline consumption data to inform how to cut gasoline use faster and more equitably with electric vehicles. It was featured in the New York Times and Forbes.

Sentiment analysis of Hillary Clinton's emails from her tenure as U.S. Secretary of State in R, revealing insights into political dynamics and communication patterns.
As part of my coursework for UC Berkeley's POLSCI 132B, I performed an in-depth sentiment analysis of Hillary Clinton's emails during her time as U.S. Secretary of State, specifically examining her correspondence related to the U.S. House of Representatives around the 2010 midterm elections. The study identified shifts in Clinton's sentiment leading up to the election and compared these trends to those of her closest advisors, known as "Hillaryland," and senior advisor Jacob Sullivan. Key findings included a downturn in Clinton's sentiment preceding the election, contrasting with her advisors' post-election negativity. The analysis combined sentiment ratios and principal component analysis, highlighting differences in tone while affirming consistent vocabulary use across sender groups. This nuanced exploration of political communication offered a window into the interplay between sentiment and historical political events.

Statistical analysis in Python focusing of the relationship between American partisanship, national attention on elections, and voter engagement using data, featuring hypothesis testing and causal inference techniques.
I investigated the connection between partisan polarization, national attention on elections, and voter engagement in the U.S. during the 2018 election cycle as part of my coursework for UC Berkeley's DATA C102. This project utilized data from FiveThirtyEight, the U.S. Census, and other sources to explore how partisan lean impacts endorsements by organizations and individuals, as well as voter turnout rates. Employing advanced techniques such as hypothesis testing and causal inference, the study revealed that endorsements are more likely in swing districts than in polarized ones but found no clear causal relationship between partisanship and voter turnout after adjusting for confounders. The findings provide valuable insights for political campaigns to optimize resource allocation and engagement strategies. The work highlights the complexity of political behavior and underscores the importance of combining data science with social science methodologies for a comprehensive understanding of voter dynamics.

Data-driven tool to assess NBA player value, predict salaries based on performance metrics, and classify players by their contribution level, assisting teams in roster optimization.
I designed a comprehensive tool to evaluate NBA player value by predicting salaries using historical performance data and advanced statistics for my coursework in UC Berkeley's DATA 144. The project developed a two-model pipeline: one to estimate a player's fair salary based on key metrics and another to classify players into value categories like "elite" or "replacement level" based on their contributions. The tool aids teams in identifying undervalued talent, optimizing roster construction, and making informed salary decisions. Tested on a decade of NBA data (2011–2021), the tool demonstrated practical use cases for small-market teams and general managers by uncovering potential talent and providing insights into player market efficiency.

A C# game where players take on the role of a shopkeeper, buying materials, crafting items, and haggling with adventurers to earn gold and manage their shop while keeping up with town events.
Contributed to the development of a C# role-playing game where players experience the unique perspective of a shopkeeper in a fantasy RPG world. Players engage in buying materials, crafting valuable items, and using strategic negotiation to haggle with adventurers. The game challenges players to balance earning enough gold to pay weekly rent with staying informed about town happenings.

Java-based, pseudo-randomly generated space-themed game where players navigate through dynamic environments to collect broken spacecraft parts and evade alien obstacles.
I designed and built a space-themed game entirely in Java, featuring pseudo-randomly generated environments for a unique player experience each time as part of my coursework for UC Berkeley's CS61B. Players navigate through outer space to collect broken spacecraft parts while avoiding alien obstacles. The game was crafted from the ground up, incorporating algorithmic complexity, data structure implementation, and interactive visual design.

NLP analysis to classify and analyze behavior across a dataset of 44,000 users, uncovering key customer insights.
Spearheaded the “Others” project during my internship at Promo.com, focused on understanding and classifying user behavior for a dataset of 44,000 users who labeled themselves as “Other” during onboarding. Leveraged Natural Language Processing (NLP) to process and cluster user-generated text data, identifying five distinct user verticals and classifying nearly 20,000 users. This project revealed critical insights into untapped customer segments and highlighted opportunities to align product offerings with diverse user needs. The work involved advanced Python skills, data cleaning, feature engineering, and visualization, showcasing my ability to handle complex datasets and derive actionable business insights.
